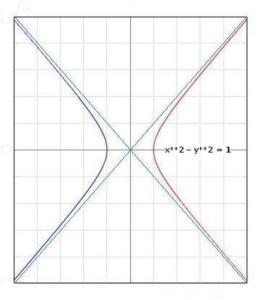
The parabola, ellipse, circle, and hyperbola are all termed conic sections. This means that a plane that cuts into a cone in just the right way will generate one of these figures. We will consider the basic equation of a hyperbola and graph one.
Equation of an Hyperbola
It may be recalled the equation for an ellipse centered at the origin is,
x2/a2 + y2/b2 = 1
where 2a is the length of the ellipse and 2b is its height.
The equation for an hyperbola centered at the origin is very similar,
x2/a2 – y2/b2 = 1
The graph of this function is completely different from that of an ellipse. Let’s look at a very basic one, for which a = b = r. We derive,
x2 – y2 = r2
Let’s choose r = 1. We then have,
x2 – y2 = 1
The graph of this curve is seen in the image associated with this article. Notice in that image that the closest the two halves of the curve come together is equal to “2 times r.” In this case, that equals 2.
The red-half and the blue half in the graph are part of the same curve. The green lines are called asymptotes, since the “arms” approach the lines, but never quite reach it. If the equation had been,
y2 – x2 = 1
the branches of the hyperbola would have been, not left and right, but top and bottom. The overall shape would have been the same, and the asymptotes would have been the same asymptotes.
Effects of Adjusting Parameters
If in our equation we increase r, we increase the distance between the halves of the hyperbola. If we adjust put a number in front of the y or the x (or one number before the y and a different number before the x), we change the opening of the two halves of the hyperbola.
In addition, there are ways of rotating the curve, and of shoving it to the right or the left or up or down. Still, what we have discussed here should give us a basic understanding of what an hyperbola is.
Note: You might also enjoy Analytic Geometry: The Parabola
References:
← Back to Math-Logic-Design
← Home
